Insights Architecture
- Akshay Sharma (Unlicensed)
- Abirami
- Susmita Bhattacharjee (Unlicensed)
Owned by Akshay Sharma (Unlicensed)
Last updated: Mar 01, 2022 by Abirami
Detailed information on various Insights components, and the Insights Architecture is covered under this section.
Insights Architecture - Components
Insights Architecture - Visual Representation
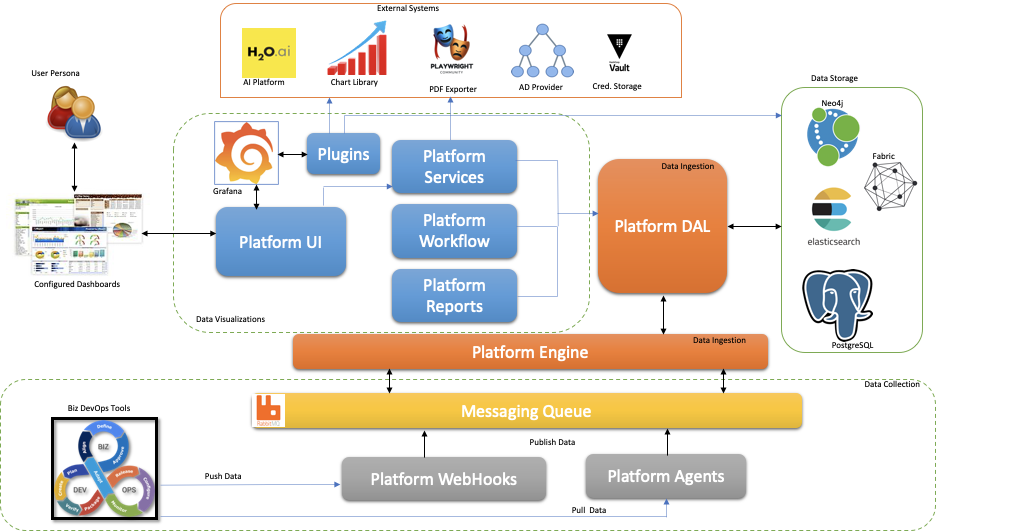
Platform Agents
- Insights contains Agents / Tools data collectors written in Python programming language for various DevOps Functional Blocks such as Application Lifecycle Management(ALM), Software Configuration Management(SCM), Continuous Integration(CI), Artifact Management, Code Quality, Continuous Testing, Deployment, and Cloud.
- These Python Agents collect tool data from various tools such as Jira, Rally, GitHub, Bitbucket, Jenkins, Bamboo, Docker, Rundeck etc., using RESTful API calls from these given tools.
- Once the agent collect data, it starts publishing the results into RabbitMQ.
- Insights supports 32 different tools across DevOps functional blocks.
Platform Webhooks
- Platform Webhooks provides a way by means of collecting data from the various BizDevOps tools using the push mechanism
- The Webhook of Insights is exposed as a URL endpoint and the same URL is mentioned in the corresponding tool.
- The tool is configured to send the information related to any change to the webhook endpoint. For example, in Jira the webhook configuration could be to send the information related to a creation of a new story to the endpoint.
- The webhook application collects the data which was posted to it, process the same and pushes the same to RabbitMQ. The engine then acts on this information for further processing.
RabbitMQ
 RabbitMQ is an open source message broker software that originally implemented Advance Message Queuing Protocol(AMPQ), and has since been extended with a plug-in architecture to support Streaming Text Oriented Messaging Protocol (STOMP), MQTT, and other protocols.
- In Insights, RabbitMQ acts as a message broker between the Platform Agents, Platform Webhooks and the Platform Engine.
- It also acts as communication mechanism between the platform service and Platform Workflow as well.
- Any component in the platform uses the RabbitMQ as an medium to establish communication between the other components.
Platform Engine
- Platform Engine runs between RabbitMQ and Neo4j DB. It consumes the data from RabbitMQ and creates the necessary nodes in Neo4j DB along with the co-relations between them.
- Once it collects the data from the RabbitMQ queues, it applies Co-relation logic, Business Mapping (according to project hierarchy), and the corresponding node is created under following tool labels in Neo4j DB.
- It also has the capability to run offline queries against Neo4j in order to ensure appropriate data related mapping is present for the Dashboards.
Data Storage & Platform DAL
- Data Storage section has three different databases such as
 Neo4j (Graph DB),
  Elasticsearch (NoSQL DB), HyperLedger Fabric and
  PostgreSQL (SQL DB).
 - Neo4j DB is used as the primary storage medium. ElasticSearch is used for Caching and also stored as an archival medium for Neo4j Data
- HyperLedger Fabric is used for storage particularly in the case of auditing functionality and it is an optional system.
- PostgreSQL is used by Grafana to store the Dashboard and user related information. It is also used by the platform to store information related to Agents, Workflow and other configurations.
- The access to these various data storage systems are abstracted and the entire system talks to these entities only using Platform DAL
Platform Workflow
- Platform Workflow is the system which is used to configure reporting templates which needs to be run based on configured intervals.
- For each report - there needs to be a series of tasks needs to be executed. The order of the tasks, the exchange of information between them and the execution of these tasks is taken care by the workflow engine.
- The workflow makes use of the templates which are already configured. The atomic unit is called KPI. Each KPI can have one or more content associated with it. Multiple KPI put together makes a report template. For more information on Workflow and Templates configuration you can click here
- Based on specific KPI and content configured the workflow helps to generate inferences for specific KPI
Platform Reports
- Platform Reports is the system which is responsible to the conversion of the executed KPI data to human readable reports.
- Once the execution of the tasks are completed, the platform reports assembles the KPI in the needed reporting format.
- The reports uses the template and the stylesheet which has been configured for each report type.
- It also uses the external charting library to build advanced visualisations and then connects with the PDF converter to create the PDF version of the report.
- The report is then mailed to the intended audience.
Platform Service
- Platform Service refers to the collection RESTful Services for Insights Application. It consists of a set of REST API that are used by cross platforms to fetch/update the results using REST calls.
- It abstracts communication between Insights Data Access Layer (DAL), and the various Databases.
- It acts as a bridge for the entire platform in terms of communication to the external systems.
Grafana
 Grafana is an open source metric analytics & visualization suite. It is most commonly used for visualizing time series data for infrastructure and application analytics.
- Grafana communicates with Neo4j, Elasticsearch, and PostgreSQL to fetch data for dashboards, store the user profiles, and provide role based access for Insights Application.
- Insights Application uses Platform Services REST API calls to fetch results from Grafana for Authentication, User role management, and Dashboards.
Plugins
- Plugins refers to the additional functionality which has been embedded inside Grafana to provide Insights specific functionalities.
- It contains a Data source module to talk to Neo4j
- It contains a PDF export module which helps to export the dashboards to PDF
- It contains a charting library integration which helps to build advanced visualisations in Grafana.
Platform UI
- Insights UI Application is hosted over a web server, and it is point from which the end user interacts with the system.
External Systems
- External systems refers to the additional system which Insights talks to in order to fetch the relevant information
- H20 serves as the AI platform which helps to run the various models chosen and thereby help in prediction and forecasting.
- Chart Library refers to the libraries which helps to provide advanced visualisation capabilities in Grafana
- PDF exporter helps in creating the necessary PDF formats
- AD providers helps in Auth n Auth
- Vault helps in acting as a secure credential storage.
, multiple selections available,
©2021 Cognizant, all rights reserved. US Patent 10,410,152